
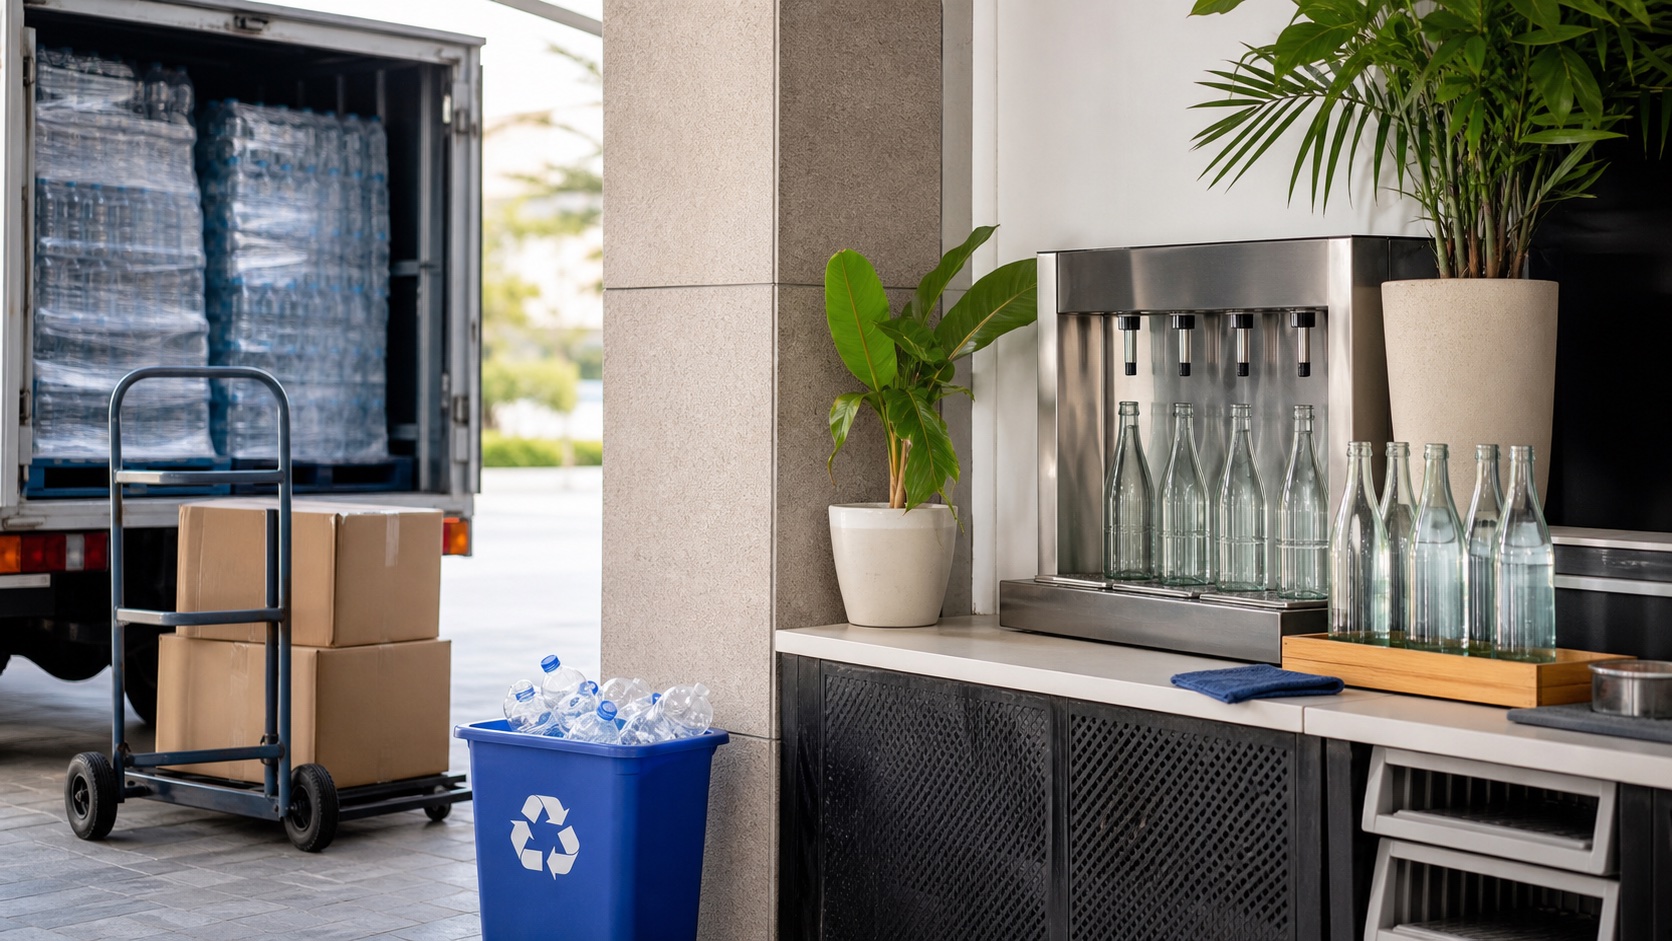
Short answer: the impact of a plastic water bottle does not begin when it enters a bin. Fossil feedstock, resin and bottle production, filling, secondary packaging, transport, cooling, waste collection, recycling, and leakage all belong in its life cycle. Replacing single-use PET with a different disposable material is not automatically a solution. UNEP’s life-cycle work finds that single use is often the larger problem and that well-run reusable systems are generally the stronger direction.1
Why One Small Bottle Becomes a Systems Problem
One light bottle appears trivial. In a hotel, apartment, office, hospital, or event venue, multiply it by rooms, occupancy, two or more consumption points, meeting spaces, restaurants, and 365 days.
An illustrative baseline—not a guaranteed savings claim—is:
100 rooms × 70% occupancy × 2 bottles per occupied room × 365 days = 51,100 bottles per year
That excludes restaurants, banquets, gyms, pools, staff use, and complimentary replacements. Actual purchasing and waste records provide a better baseline than assumptions.
Seven Stages in the Footprint of Bottled Water
1. Feedstock and plastic production
Most plastics begin with fossil feedstocks. OECD estimates that the plastics life cycle generated 1.8 billion tonnes of greenhouse-gas emissions in 2019, or approximately 3.4% of the global total; 90% came from production and conversion.2 This covers all plastics, not bottled water alone, and should not be presented as the footprint of one bottle.
2. Bottle and closure manufacturing
PET resin is dried, melted, moulded into preforms, and blown into bottles. Caps, labels, shrink wrap, cartons, pallets, and stretch film add materials that may use different polymers and need separation later.
3. Water abstraction and treatment
Water must be abstracted, treated, tested, and filled. A United Nations University review highlights limited transparency around bottled-water abstraction volumes and the fact that local source impacts vary.3
4. Transport and storage
Water is heavy: one litre is close to one kilogram before its container is counted. A study of bottled-water energy found that long-distance transport can require energy comparable to—or greater than—bottle production.4 The actual result depends on distance, transport mode, backhaul, warehousing, and last-mile routing.
5. Cooling and building operations
Bottles may be cooled by distributors, warehouses, minibars, vending machines, and restaurants. Hotels also use staff time and space to receive, count, store, deliver, retrieve, sort, and remove the containers.
6. Recycling
“Recyclable” does not mean a bottle is collected and made into another bottle. OECD estimates that only 9% of global plastic waste was ultimately recycled in 2019; that is an all-plastics figure, not a bottle-grade PET recycling rate.2
Contamination, colour, labels, mixed materials, transport distance, recycled-resin pricing, and local demand determine the real outcome. Recycling remains important, but it follows reduction and reuse in the action hierarchy.
7. Leakage into the environment
The World Bank estimates that Indonesia generates approximately 7.8 million tonnes of plastic waste annually, of which 4.9 million tonnes is mismanaged. It estimates 346,500 tonnes per year reaches the marine environment from land-based sources.5 These are figures for all plastic waste, not water bottles alone. They nevertheless show the risk of relying on end-of-pipe collection where service coverage is uneven.
The Global Scale of Bottled Water
A 2023 UNU review collated an estimate of roughly 600 billion plastic water bottles and containers, equivalent to about 25 million tonnes of PET waste.3 This global estimate combines multiple information sources; it is not a facility inventory or a number to apply directly to one country.
The scale explains why lightweighting alone is insufficient. A thinner bottle remains single use if procurement, distribution, and consumption do not change.
Are Glass, Cans, or Cartons Always Better?
Not automatically. Glass is heavier to transport and requires energy to produce and wash. Aluminium has a large initial production burden even though it can retain recycling value. Beverage cartons can contain multiple layers that not every region can separate.
A better comparison asks:
- how many times the container is actually reused;
- how far the water and container travel;
- how much water and energy washing and sanitation require;
- breakage and loss rates;
- the carbon intensity of electricity;
- whether collection and recycling facilities genuinely exist.
“Replace plastic with single-use glass” is a different system from “wash, inspect, and reuse a glass bottle dozens of times.”
A More Useful Hierarchy for Buildings
- Eliminate: remove unnecessary bottles and make drinking water easy to access.
- Reduce: align quantity, size, and replenishment with measured demand.
- Reuse/refill: provide bottles or carafes supported by washing, sanitation, inspection, and traceability.
- Recycle: segregate residual packaging and verify the collector and material destination.
- Measure: track purchasing, distribution, container loss, washing energy and water, quality results, and user complaints.
Moving from Bottles to On-Site Treated Water
The design depends on source-water quality and layout:
- point-of-entry treatment for sediment, chlorine, hardness, or building-wide problems;
- point-of-use UF/carbon for appropriate target parameters;
- under-sink RO where analysis shows TDS or dissolved contaminants need reduction;
- central RO and reusable bottling where volume, a hygienic room, and internal distribution support it;
- floor or public refill stations with documented cleaning and maintenance.
See the hotel and apartment drinking-water guide and the roadmap from bottles to refill water. POU options include Pentair EU-25 UF and Everpure and Pentair ES60-S RO.
Conclusion
The bottled-water problem is not only “waste after drinking.” Its impacts span feedstock, production, logistics, and end of life. The solution is likewise not a simple swap between disposable materials. Hotels and apartments can make a stronger decision by measuring their baseline, testing water, establishing a hygienic refill system, and verifying that reusable containers complete enough cycles to deliver a real life-cycle benefit.
References
Footnotes
-
United Nations Environment Programme, Addressing Single-Use Plastic Products Pollution using a Life Cycle Approach, 2021. ↩
-
OECD, Global Plastics Outlook—Executive Summary, 2022. ↩ ↩2
-
United Nations University Institute for Water, Environment and Health, Global Bottled Water Industry: A Review of Impacts and Trends, 2023. ↩ ↩2
-
Gleick & Cooley, “Energy implications of bottled water”, Environmental Research Letters, 2009. ↩
-
World Bank, Plastic Waste Discharges from Rivers and Coastlines in Indonesia, 2021. ↩