
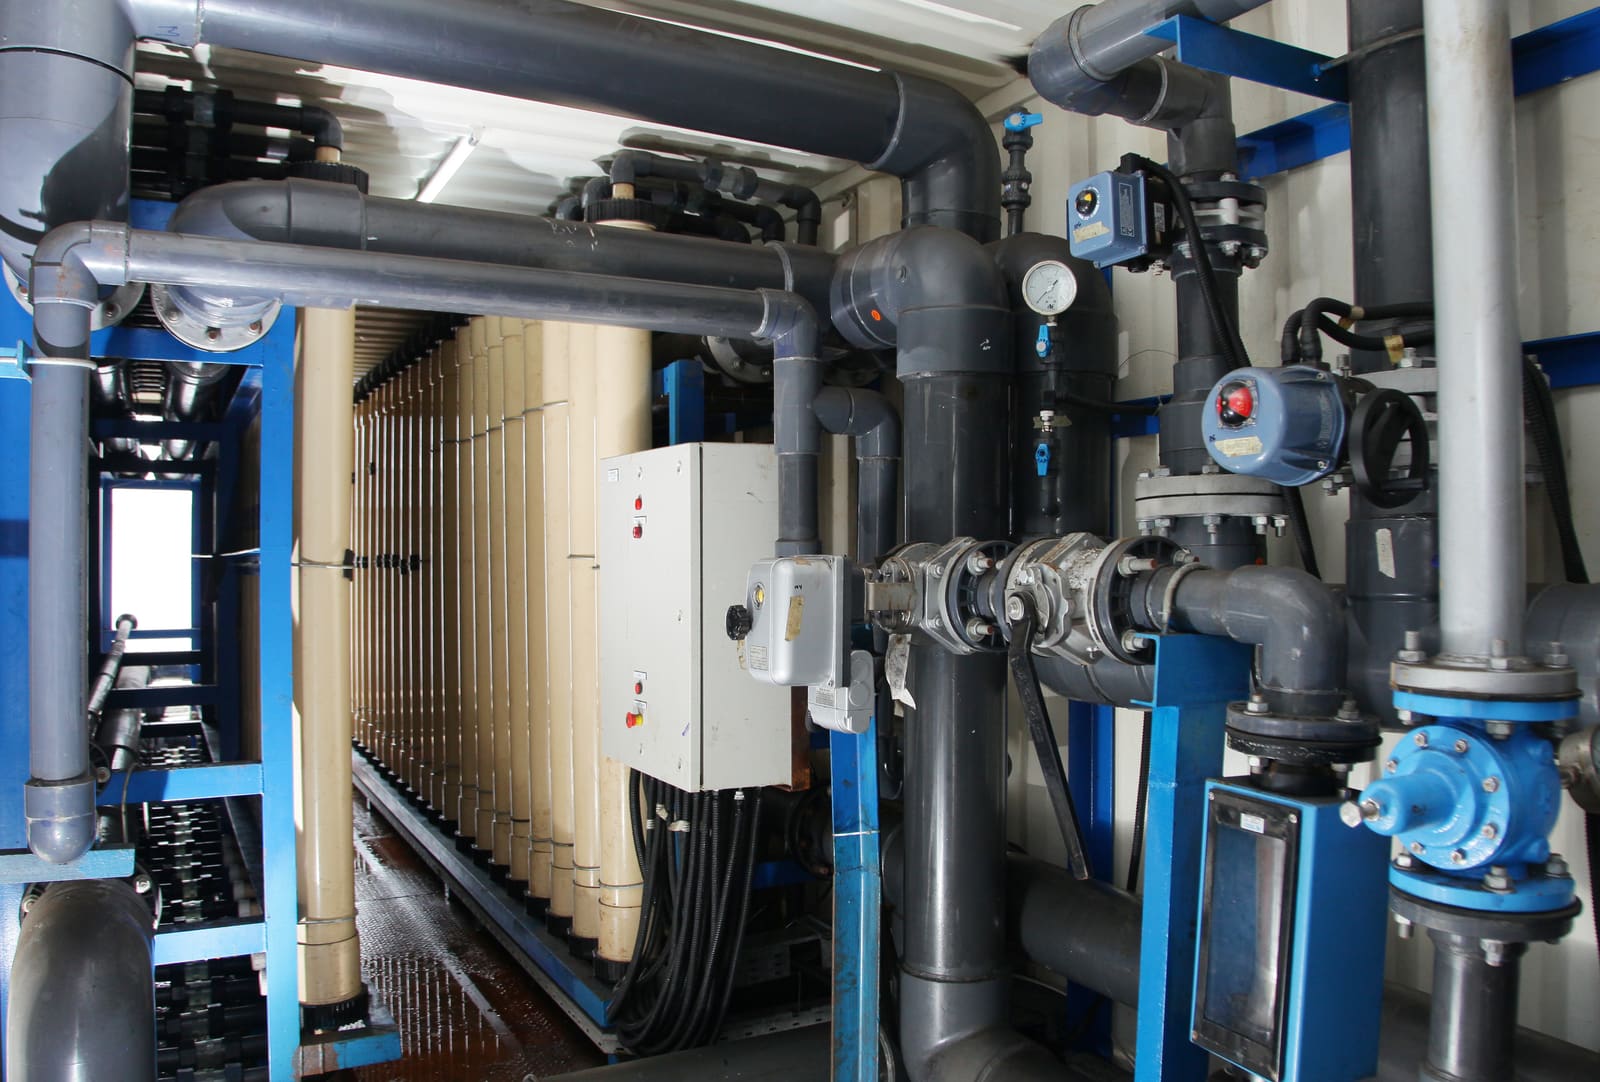
Correct ultrafiltration (UF) membrane sizing uses net capacity after backwash, forward flush, CEB, and downtime—not instantaneous filtration flow. Calculate membrane area from required net flow and design flux, round the module count, then simulate every cycle step. Define integrity testing and acceptance records during design so broken fibers can be distinguished from fouling or instrument error.
This guide provides an auditable preliminary worksheet, not a substitute for manufacturer design or pilot testing. PT Watermart Perkasa supplies DuPont IntegraTec UF modules, Toray ultrafiltration membranes, and Asahi membranes for selection against feedwater analysis, filtrate targets, and the approved operating sequence.
Inputs Required for UF Membrane Sizing
Six figures can establish an initial module count, but the design should not be issued until feed quality, temperature, fouling potential, filtrate quality, and the selected model’s hydraulic and chemical limits have been checked.
| Symbol | Design input | Unit | Defensible source |
|---|---|---|---|
| Qnet | Required net filtrate flow | m³/h | Demand balance, storage level, operating hours, and peak demand |
| J | Gross filtration flux | L/m²/h (LMH) | Manufacturer guidance and pilot results on design feedwater |
| A | Active membrane area per module | m² | Datasheet for the grade/module being purchased |
| Fnet | Net-production factor after all cycle losses | decimal | Filtration, backwash, flush, CEB, CIP, and downtime simulation |
| T | Design water temperature | °C | Relevant cold and hot conditions |
| Ntrain | Train count and redundancy philosophy | trains | Production risk, maintenance, and duty/standby requirement |
Also document turbidity, TSS, TOC/DOC, SDI where UF protects RO, maximum particle size, oil, iron, manganese, algae, and seasonal variation. Those data determine pretreatment and piloting needs; they are not optional refinements to a module-count calculation.
UF Module-Count Sizing Worksheet
Use this sequence to keep membrane capacity and production losses from disappearing into one unauditable allowance.
- Select a preliminary flux from model guidance and feed basis. Do not use maximum datasheet flux as continuous design flux.
- Take active module area from the datasheet.
Qg,module (m³/h) = J × A ÷ 1,000. - Estimate preliminary net production.
Qnet,module = Qg,module × Fnet. - Calculate minimum modules.
Nminimum = target Qnet ÷ Qnet,module. - Round up and arrange modules by train. Decide whether the target must be met with one train offline.
- Recalculate actual flux.
Jactual = target Qnet × 1,000 ÷ (Ninstalled × A × Fnet). - Simulate the cycle explicitly. Calculate filtrate, backwash, forward-flush, drain, CEB, and non-producing time.
- Verify hydraulics. Check per-module flow, TMP, backwash flow, headers, pumps, tank volume, drains, air scour, and valve scenarios.
Fnet is not a universal constant. It changes with filtration duration, backwash frequency and flux, forward flush, CEB, CIP, start-up reject, train count, and cleaning schedule. Use an initial factor only to establish geometry; final capacity comes from the cycle simulation and supplier performance guarantee.
Worked Example: 20 m³/h Net UF Capacity
This example uses a DuPont™ IntegraTec™ MB 80 TR with 80 m² of active area per module, as stated in its September 2024 product data sheet.1 A 45 LMH flux and 0.85 preliminary net factor are worksheet assumptions, not universal recommendations. Assume 20 m³/h net capacity is required with all trains operating.
| Step | Calculation | Result |
|---|---|---|
| Gross flow per module | 45 × 80 ÷ 1,000 | 3.60 m³/h |
| Preliminary net flow per module | 3.60 × 0.85 | 3.06 m³/h |
| Minimum modules | 20 ÷ 3.06 | 6.54 modules |
| Installed modules | Round up | 7 modules |
| Installed membrane area | 7 × 80 | 560 m² |
| Equivalent net flux | 20 × 1,000 ÷ 560 | 35.71 LMH |
| Gross flux required at Fnet 0.85 | 35.71 ÷ 0.85 | 42.02 LMH |
The preliminary result is seven modules, but this does not prove 20 m³/h during a train outage or CEB. If the design requires full output with one train offline, repeat the calculation using only the membrane area still available and verify every module-flow and header limit under that condition.
Temperature must not be hidden in a generic margin. DuPont’s April 2026 manual explains that colder water increases viscosity and can increase the TMP required to hold flux; performance data should be normalized so temperature effects are not mistaken for fouling.2 Use the selected model’s temperature method rather than one factor for every membrane material.
Backwash, CEB, and Net-Production Calculation
Backwash pump and tank capacity follow the backwash flux across all modules washed simultaneously, not net product flow. The basic equations are:
Qbackwash (m³/h) = Jbackwash (LMH) × area in one event (m²) ÷ 1,000
Vbackwash (m³/event) = Qbackwash × backwash duration (seconds) ÷ 3,600
The MB 80 TR product data sheet lists a suggested backwash flux of 230 LMH and a maximum of 300 LMH; a maximum is not a design set point.1 If all seven modules—560 m²—are washed together at 230 LMH for an assumed 45 seconds:
| Item | Calculation | Result |
|---|---|---|
| Backwash pump flow | 230 × 560 ÷ 1,000 | 128.8 m³/h |
| Backwash volume | 128.8 × 45 ÷ 3,600 | 1.61 m³/event |
| Filtrate during 30 minutes at 45 LMH gross | 45 × 560 ÷ 1,000 × 0.5 | 12.60 m³ |
| Net before other flushes | 12.60 − 1.61 | 10.99 m³/cycle |
| Average over 30-minute filtration + 45-second backwash | 10.99 ÷ 0.5125 | 21.44 m³/h |
This still omits forward flush, drain, filtrate-to-waste, CEB, CIP, and train failures. With only 1.44 m³/h above target, the CEB schedule may reduce average production below 20 m³/h. Enter each step with its flow and duration, then test the hourly, daily, and monthly balance.
Backwash and CEB design checklist:
- pump capacity at actual dynamic head and all modules washed at once;
- usable tank volume after dead volume, low-level trip, and consecutive events;
- backwash-water source and quality;
- drain capacity for peak flow without flooding the skid;
- air-scour flow, air quality, and valve sequence where used;
- concentration, pH, temperature, contact time, and compatibility within module limits;
- interlocks that prevent chemical feed in the wrong valve state;
- neutralization or disposal route for CEB/CIP waste under site procedures.
Where the project needs a CEB/CIP chemical program, match membrane materials and manufacturer limits with Beta Pramesti’s industrial water-treatment support. Watermart supplies LMI and OBL dosing pumps for the injection hardware, sized from actual L/h and line pressure.
When to Reduce Flux or Run a Pilot
Reduce preliminary flux or pilot the process when feed quality varies widely, pretreatment is unproven, organic or biological fouling is material, oil may be present, backwash recovery is uncertain, or filtrate quality is a critical acceptance gate. The pilot should reproduce membrane model, flow mode, pretreatment, temperature range, filtration cycle, backwash, CEB, and integrity test planned for the full plant.
At minimum, log feed and filtrate turbidity, TSS, SDI where relevant, flows, feed/filtrate/concentrate pressures, TMP, temperature, gross flux, normalized permeability, backwash flow/duration, CEB, and CIP. DuPont includes these fields in its example operation log so fouling trends can be separated from instrument faults and temperature changes.2
Direct and Indirect UF Membrane Integrity Tests
Indirect integrity monitoring tracks filtrate quality—such as turbidity or particle count—during operation. Direct integrity testing applies a physical test such as pressure decay to an isolated unit. Indirect monitoring gives rapid warning; a direct test assesses leakage at the sensitivity established for the system.
For U.S. drinking-water installations claiming removal credit under the LT2ESWTR, 40 CFR 141.719(b)(3) addresses direct integrity testing and 40 CFR 141.719(b)(4) addresses continuous indirect integrity monitoring. EPA’s Membrane Filtration Guidance Manual, EPA 815-R-06-009, covers pressure/vacuum decay, diffusive airflow, water displacement, and marker tests.3 These U.S. compliance figures are not Indonesian regulations; follow the project’s applicable law and authority approval.
Method, pressure, duration, and acceptance limit must come from the module manual and commissioning baseline. As a DuPont IntegraTec-specific example, the April 2026 manual recommends a Pressure Decay Test on a clean, offline train: raise oil-free air slowly to 1.5 bar, do not exceed 2 bar, stabilize, hold for five minutes, and compare decay with the system limit; it lists ≤0.05 bar over five minutes or the value calculated for the specific design.2 Do not apply those values automatically to another brand.
Integrity-Test Acceptance Procedure
- Confirm train/module tags, model, area, serial numbers, clean condition, and valid instrument calibration.
- Isolate the train from feed, filtrate header, chemical lines, and other trains under the P&ID and lockout procedure.
- Verify that pressure source, relief, regulator, gauge/transmitter, and valve arrangement match the manufacturer manual.
- Run the automatic or manual sequence; record baseline pressure, stabilization time, test pressure, duration, decay/airflow, and temperature.
- Compare results with the approved acceptance limit—not an operator’s remembered number.
- On failure, check valves, seals, couplings, tubing, and instruments before concluding that a fiber is broken.
- Isolate the indicated module, diagnose or repair it under the manual, then repeat the direct test.
- Return the train to service only after a pass and after filtrate-to-waste/rinse meets release criteria.
Retain both passing and failed results. Trends in pressure decay, turbidity, particle count, TMP, and normalized permeability help distinguish an integrity breach from fouling, water hammer, chemical excursion, gasket leakage, or instrument drift.
Commissioning and Operations Handoff Checklist
| Gate | Required evidence |
|---|---|
| Design basis | Feed analysis, filtrate target, Qnet, temperature range, design flux, module datasheet, cycle simulation |
| Hydraulic test | Flow/pressure in every mode, valve timing, pump curve, tank levels, drain capacity, alarms and trips |
| Water-quality acceptance | Feed and filtrate samples, project turbidity/TSS/SDI parameters, sample points and methods |
| Integrity baseline | Method, instruments, required sensitivity/resolution, baseline, control limit, results by train |
| Cleaning validation | Backwash, CEB, CIP, chemical compatibility, rinse-to-waste, disposal, SDS |
| Operator readiness | SOP, P&ID, cause-and-effect, spares, calibration schedule, log sheets, training |
Provide these data when requesting a component schedule for DuPont IntegraTec UF, Toray UF, or Asahi UF. Add pressure, flow, and water-quality instruments and dosing pumps against actual duty rather than a generic package.
Frequently Asked Questions
Can UF module count be calculated from flow divided by flux?
Not by itself. That calculation gives gross membrane area. The final count must include backwash, flush, CEB, CIP, downtime, temperature, train rounding, and redundancy to deliver the promised net flow.
What design flux should an ultrafiltration membrane use?
There is no single value for every feed and module. Use manufacturer guidance for the selected model, water analysis, temperature range, pretreatment, and pilot results. Maximum datasheet flux is a limit, not a continuous operating target.
When should a UF integrity test be performed?
Frequency follows project regulations, manufacturer guidance, application risk, and the acceptance plan. Test after repairs, water-hammer or chemical-excursion events, and filtrate-quality alarms that indicate a possible breach.
How does pressure decay differ from turbidity monitoring?
Pressure decay is a direct integrity test on an isolated unit. Turbidity is indirect filtrate-quality monitoring that can run during production. They complement each other but have different sensitivities and control limits.
Footnotes
-
DuPont Water Solutions, DuPont™ IntegraTec™ MB 80 TR Product Data Sheet, Form 45-D02243-en, Rev. 3, September 2024. ↩ ↩2
-
DuPont Water Solutions, DuPont™ IntegraTec™ Modules Process and Design Manual, Form 45-D00874-en, Rev. 8, April 2026. ↩ ↩2 ↩3
-
U.S. Environmental Protection Agency, Membrane Filtration Guidance Manual, EPA 815-R-06-009, November 2005. ↩